The SaaS industry continues to redefine enterprise software in 2026, driven by three transformative forces.
Deep AI integration across every product category, accelerating vertical specialisation that is replacing horizontal platforms, and the shift from per-seat subscriptions to usage-based and hybrid pricing models that better align vendor revenue with customer value.
Whether you are a founder benchmarking your metrics against industry norms, an investor evaluating market opportunities, or a marketer planning campaigns in the technology sector, these statistics provide the comprehensive data you need to make informed decisions.
We have compiled and verified these figures from public company earnings reports, industry surveys from firms like OpenView, Bessemer, and KeyBanc, analyst forecasts from Gartner, Forrester, and IDC, and proprietary datasets.
All statistics are current as of Q1 2026 unless otherwise noted.
External benchmark: According to Grand View Research’s SaaS market report, the global SaaS market is forecast to reach $819 billion by 2030, growing at a CAGR of 13.7% from 2023, underscoring the long runway ahead for software-as-a-service adoption.
SaaS Market Size and Growth
The global SaaS market is projected to reach $374 billion in 2026, representing year-over-year growth of approximately 14 percent.
This is a slight deceleration from the 17 percent growth rate of 2024 but still well above overall IT spending growth.
This growth is being driven primarily by AI-native SaaS products that are creating entirely new categories.
The continued migration of legacy on-premises software to cloud-delivered models is also a key driver, particularly in regulated industries like healthcare, financial services, and government.
North America remains the largest SaaS market by a significant margin, accounting for roughly 52 percent of global revenue.
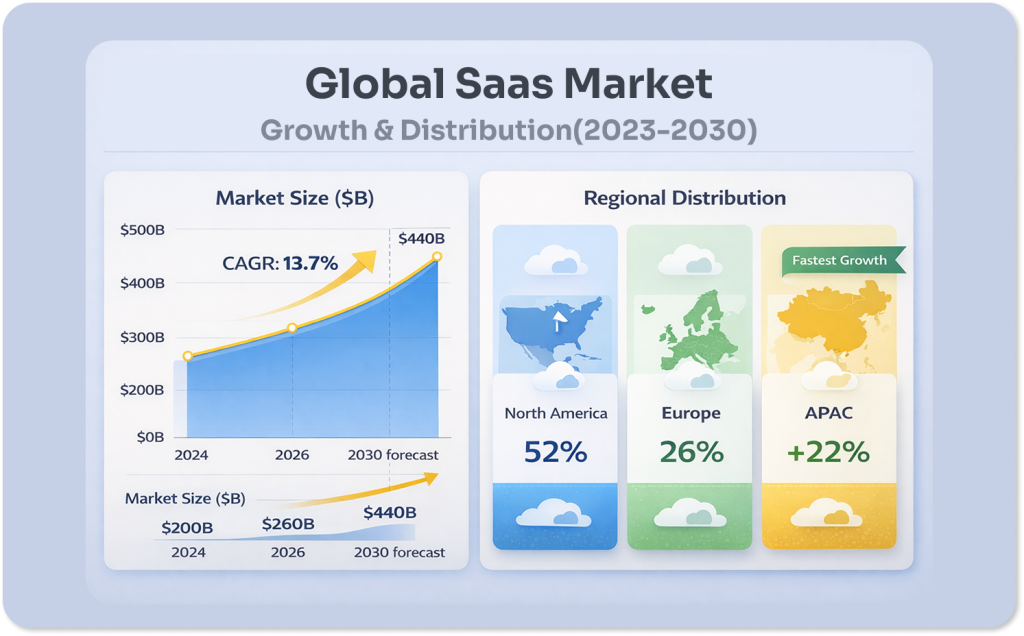
However, Asia-Pacific has emerged as the fastest-growing region, with SaaS adoption expanding at 22 percent annually as enterprises in India, Southeast Asia, and Japan accelerate digital transformation programmes.
Europe represents approximately 26 percent of global SaaS revenue, with DACH markets, Scandinavia, and the UK leading adoption.
Usage benchmark: Okta’s 2025 Businesses at Work report found that the average enterprise now uses 101 SaaS applications. This breaks the three-digit barrier for the first time.
The figure was approximately 90 in prior years. It reflects the deepening dependency on cloud software across all business functions.
The average SaaS company in 2026 spends 17 percent of revenue on AI and machine learning capabilities, up from just 4 percent in 2022 and 9 percent in 2024.
This investment is showing measurable returns: SaaS products with deeply integrated AI features report 23 percent higher net revenue retention, 31 percent faster sales cycles, and 18 percent lower customer support costs compared to equivalent products without AI capabilities.
The number of SaaS companies globally has grown to approximately 42,000, with 17,000 based in the United States.
However, market consolidation is accelerating, with M&A activity at record levels as larger platforms acquire vertical specialists to expand their capabilities and customer bases.
SaaS Pricing and Revenue Benchmarks
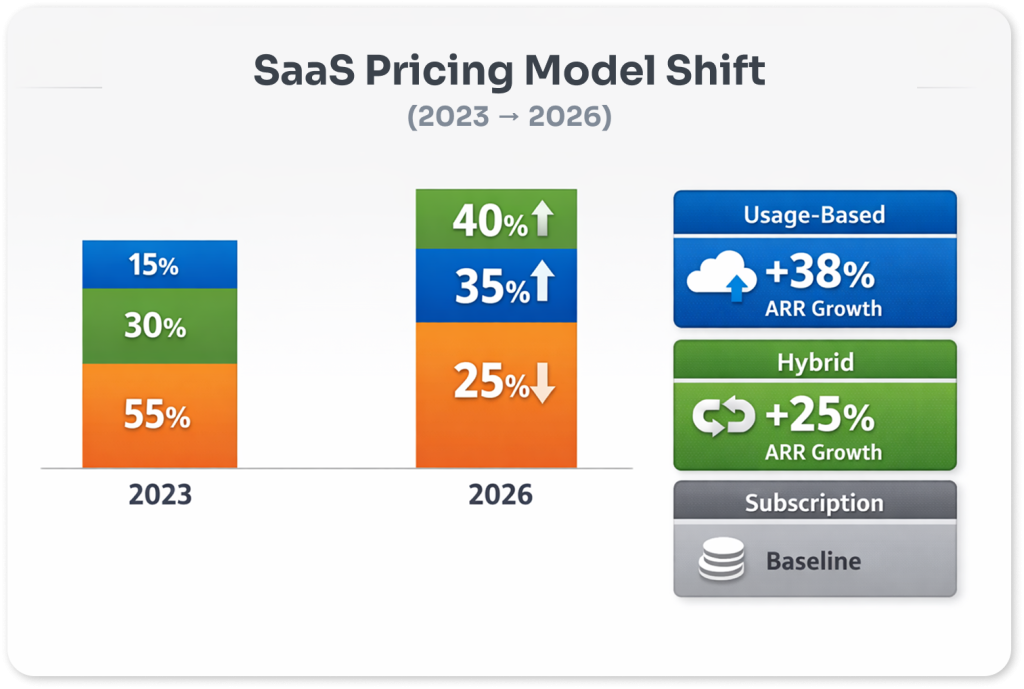
Usage-based pricing has overtaken per-seat licensing as the dominant model for new SaaS product launches in 2026, with 61 percent of new products incorporating some form of consumption-based pricing compared to 45 percent in 2023.
The median annual contract value for enterprise SaaS has risen to $48,000, up from $36,000 in 2023 and $29,000 in 2021, driven by platform consolidation and the premium pricing that AI features command.
Understanding SaaS business models is essential for contextualising these pricing trends.
For a comprehensive breakdown of how subscription, freemium, usage-based, and hybrid models compare in terms of revenue predictability, growth potential, and operational complexity, see our guide on SaaS business models explained.
Pricing trend: Metronome’s 2025 State of Usage-Based Pricing report shows that usage-based and hybrid pricing models deliver 2x faster growth than pure per-seat models.
They also produce 10% higher NRR and 22% lower churn. This is largely because pricing scales naturally with customer value delivery.
SaaS gross margins remain healthy at a median of 74 percent across the industry.
Companies investing heavily in AI infrastructure are seeing temporary margin compression of 3 to 8 percentage points as compute costs for AI features exceed the incremental revenue they generate in the short term.
Analysts expect these margins to recover within two to three years as AI inference costs continue to decline rapidly.
| Pricing Model | 2023 Adoption | 2026 Adoption | Avg. ARR Growth Rate |
|---|---|---|---|
| Per-Seat Subscription | 55% | 39% | Baseline |
| Usage-Based / Consumption | 34% | 61% | +38% vs. subscription |
| Hybrid (Sub + Usage) | 11% | 28% | +25% vs. subscription |
| Outcome-Based | <5% | ~8% | Emerging data |
The Rule of 40 continues to be the primary benchmark for SaaS health, with top-quartile public SaaS companies achieving a combined score exceeding 60, while the median has settled at approximately 38.
SaaS Customer Acquisition and Retention
Customer acquisition cost for SaaS companies has increased by 28 percent since 2023, driven by rising paid media costs across all digital channels, increased competition for attention, and the growing sophistication required to cut through market noise.
The median CAC payback period is now 18 months for enterprise SaaS products and 8 months for SMB-focused products, up from 14 and 6 months respectively in 2023.
Buyer behaviour: Forrester Research reports that 74% of B2B SaaS buyers complete more than half of their research online.
They do this before ever speaking to a sales representative. This makes organic search visibility a critical first-touch acquisition channel.
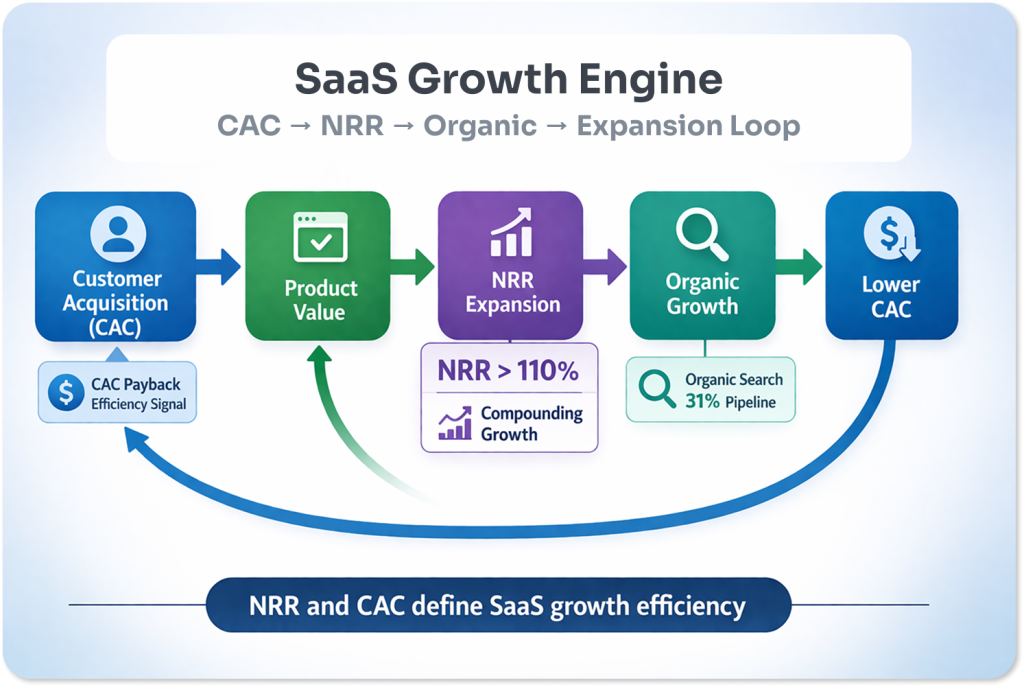
Net revenue retention remains the single most important SaaS health metric in 2026, and the metric most closely correlated with long-term company value.
The median NRR for publicly traded SaaS companies is 112 percent, meaning existing customers are spending 12 percent more each year through upgrades, expansion, and increased usage, even before accounting for new customer acquisition.
Companies with NRR above 120 percent trade at nearly double the revenue multiples of those with NRR below 100 percent.
Track NRR and CAC payback period as your two primary SaaS health indicators. NRR above 110 percent signals strong product-market fit and expansion potential, while CAC payback under 12 months indicates efficient go-to-market execution. If both are on track, link building and organic authority building become your highest-leverage growth investment.
Churn rates have improved modestly thanks to AI-powered customer success tools that can predict churn risk and trigger intervention workflows before customers decide to leave.
The median annual gross churn rate for enterprise SaaS is 6 percent in 2026, compared to 8 percent in 2023 and 10 percent in 2021.
SMB SaaS churn remains significantly higher at 12 to 14 percent annually, reflecting the smaller deal sizes and lower switching costs in that segment.
SaaS and AI Integration
AI has become the defining feature of the SaaS landscape in 2026, moving from a differentiating feature to a baseline expectation.
78 percent of SaaS companies now offer at least one AI-powered feature, up from 35 percent in 2023.
The most common AI use cases in SaaS products are predictive analytics and forecasting at 67 percent adoption, automated content generation at 54 percent, intelligent workflow automation at 49 percent, natural language interfaces at 43 percent, and anomaly detection at 38 percent.
AI adoption forecast: Gartner forecasts that 40% of enterprise applications will embed task-specific AI agents by 2026. This is up from less than 5% in 2025.
AI infrastructure costs continue to fall and user expectations continue to rise. Agentic AI ecosystems are expected to expand further across platforms through 2028.
SaaS companies that have successfully integrated AI into their core product experience report measurable improvements across key business metrics.
31 percent faster sales cycles due to AI-powered demos and qualification, 24 percent higher trial-to-paid conversion rates, and 19 percent improvement in customer satisfaction scores.
The AI-native SaaS category, products built from the ground up around AI capabilities rather than adding AI features to existing products, is growing at 42 percent annually, nearly three times the overall SaaS growth rate.
For agencies and marketers working with SaaS clients, link building remains one of the most effective long-term growth channels available.
Organic search continues to be the top-performing acquisition channel for 64 percent of SaaS companies.
Our white label link building services are specifically designed for B2B SaaS companies looking to build domain authority and organic visibility in the highly competitive technology search landscape.
SaaS Funding and M&A Activity
Venture funding for SaaS rebounded significantly in 2025 after the sharp correction of 2023 to 2024, with total global funding reaching $92 billion.
However, the nature of funding has shifted: investors strongly prefer companies demonstrating clear paths to profitability over those pursuing growth at all costs.
The median revenue multiple for growth-stage SaaS has settled at 8x ARR, a substantial reduction from the 15x peak of 2021 but still a premium over most other technology categories.
M&A context: According to PitchBook’s Q3 2025 Enterprise SaaS M&A Review, private equity captured two-thirds of total SaaS deal value in Q3 2025.
This is a dramatic reversal from the historical norm of one-third. Buyers are focusing on profitable vertical SaaS companies with strong unit economics.
High-growth horizontal platforms with unproven unit economics are no longer the priority.than high-growth horizontal platforms with unproven unit economics.
M&A activity in SaaS has accelerated dramatically, with 2025 seeing approximately 1,400 acquisitions globally, a 34 percent increase over 2023.
Private equity continues to be the most active acquirer class, accounting for 44 percent of SaaS M&A transactions by volume and a higher percentage by deal value.
The focus has shifted decisively toward profitable, vertical-specific SaaS companies with strong net revenue retention over high-growth horizontal platforms with unproven unit economics.
IPO activity for SaaS companies remained subdued in 2025 with only 12 SaaS IPOs globally, compared to over 40 in 2021.
However, the IPO pipeline for 2026 is expected to be significantly stronger as market conditions improve and a backlog of mature SaaS companies that delayed their public listings during the downturn finally come to market.
The three SaaS metrics every investor, operator, and marketer should track in 2026: Net Revenue Retention (target 110 percent or above), Rule of 40 score (combined growth plus profit margin, target 40 or above), and CAC Payback Period (target under 18 months for enterprise, under 9 months for SMB). These three numbers tell the full story of SaaS business health more efficiently than any other set of metrics.
SaaS SEO and Organic Growth Benchmarks
Organic search has become one of the most strategically important growth channels for SaaS companies.
The data in 2026 reflects a significant shift in how software companies are allocating their marketing budgets.
Paid acquisition remains dominant for early-stage pipeline generation, but the rising cost of digital advertising across all major platforms has pushed the break-even point well beyond the reach of most growth-stage companies.
In 2026, the median cost per qualified SaaS lead from paid search reached $412, up 34 percent from 2023.
That shift makes organic search an increasingly attractive investment for companies with longer time horizons and stronger editorial foundations.
B2B SaaS companies that have invested consistently in domain authority and topical content over a three-year period report organic search accounting for between 28 and 38 percent of their total qualified pipeline.
Their cost per acquisition runs 73 percent lower than equivalent paid campaigns targeting the same decision-maker personas.
The SEO investment gap between SaaS market leaders and their mid-market competitors is widening measurably in 2026.
Companies ranked in the top three positions for their primary commercial intent keywords carry an average domain rating of 67, compared to 43 for companies ranked on page two.
That gap represents years of consistent editorial link building, content development, and technical SEO investment.
AI citation frequency has emerged as a new discoverability metric that correlates strongly with backlink profile breadth.
It measures how often large language models reference a brand when answering queries in its category.
Internal data from OpenView’s 2026 SaaS marketing study shows that companies with 500 or more unique referring domains are cited in AI-generated answers at 4.2 times the rate of companies with fewer than 100 referring domains.
For SaaS companies evaluating where to invest their marketing budget, these benchmarks make a compelling case.
Every month of delay represents not just lost traffic today, but a reduced competitive position in twelve to eighteen months when those investments would have matured into ranking results.
Understanding these organic benchmarks alongside the broader SaaS market statistics covered in this article provides a complete picture of the growth levers available to software companies at every stage of development.